NeoProteomics

Expertise. Innovation. Results.

Epitope Mapping Service

Neo offers covalent labeling (CL) and mass spectrometry (MS) services to industry professionals to characterize therapeutic proteins. These services precisely define epitopes for antigen targets and provide structural characterization of therapeutic proteins suitable for biosimilarity comparisons or any relevant structural definition of the product. Specifically, CL-MS (often called protein footprinting) provides a high-resolution and sensitive readout of the side chain environment (e.g., solvent accessibility) for virtually all side chains of a protein of interest. Changes in solvent accessibility of side chains due to ligand binding (e.g., epitope mapping), sequence or process variation, or changes in solvent are easily read out by the technology and are immediately structurally interpretable.

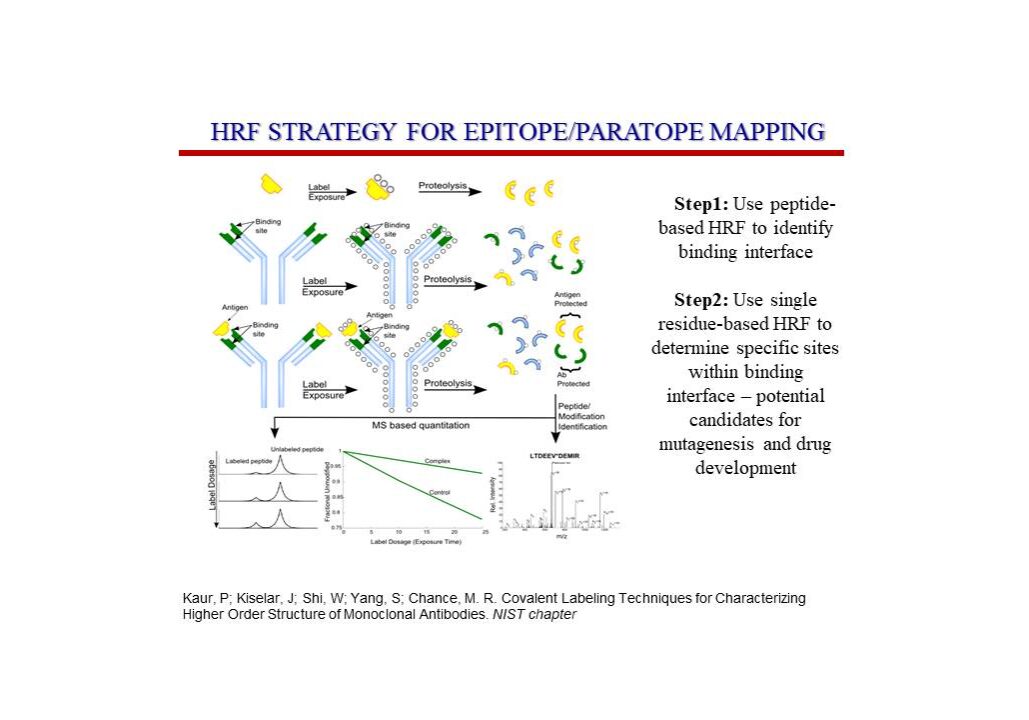
In this figure, we illustrate a typical HRPF workflow for an epitope mapping experiment:

  • Samples were exposed to x-rays for 0, 10, and 15 milliseconds.
  • Samples were deglycosylated using PN-GaseF and digested using trypsin.
  • Digested samples were subjected to reverse-phase HPLC and MS using Orbitrap Elite.
  • ProtMapMS was used for data analysis.
  • ProtMapMS uses tandem MS for identification and localization of labeled residues. It extracts single-ion chromatograms from the MS1 data for quantifying the extent of modification, resulting in the final dose response (DR) plots and the final rate constants (RC) for each peptide.
  • Swiss-Model was used to perform homology modeling using two Fab domains based on 3QWO, one Fc domain based on 1HZH, and an overall IgG Fab/Fc arrangement based on 1IGY.
  • The MS data are acquired using high-resolution LC-MS and analyzed, resulting in dose response plots for each peptide. Peptides from the antigen that show changes in modification against the complex are further analyzed for labeling at each residue.

Delivering the results with highest accuracy.
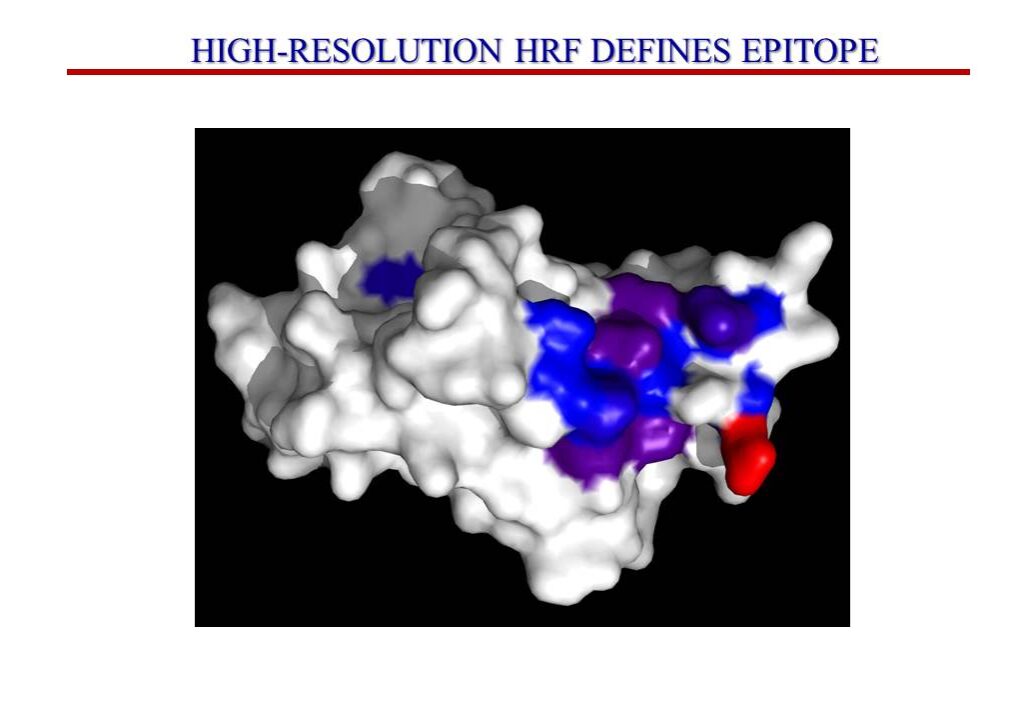
Fig 3: Antigen protein surface representation showing detected residues color-coded by PR value. PR of 1.2-1.4 (purple), PR 1.4-1.9 (blue), and PR ≥ 2.0 (red). Residues in white have PR < 1.2. The identified “patch” of protections reveals a conformational epitope

The protection ratio (PR) is calculated as the ratio of peptide or residue RCAntigen/RCComplex.

The PR value for given peptide < 1 suggests that the corresponding region experienced gain in solvent accessibility, PR»1 indicates that the solvent accessibility of the region remains unchanged, and a PR>1 suggests that the corresponding region exhibits protection from the solvent as a function of complex formation.

Peptides with the highest PR value are examined individually as these residues are proven to be the binding interface between antibody and antigen.

Importantly, the HRF technique identifies conformational epitopes.

High-resolution HRF provides specific residues that are candidates for mutagenesis experiments and potential targets for mAb design.

Contact us today for additional details about epitope mapping.